[Tutorial] Using Segger’s Ozone debugger with the RTL8722 EVB

If you are troubleshooting an unexpected behavior in your code, it often beneficial to be able to see the values of variables while your code is running to speed up debugging. This tutorial shows how to use a Segger J-Link debugger probe, together with the Ozone standalone debugging software, to debug your code running on the RTL8722 EVB.

Step 1: Get a debugger probe.
You will need to get a Segger debug probe first if you have yet to get one. The various models and specifications can be found at J-Link Debug Probes by SEGGER – the Embedded Experts. It is fine to buy the EDU or EDU mini version of the debug probe, these are often the cheapest option.

Step 2: Install required software.
From this link: SEGGER - The Embedded Experts - Downloads - J-Link / J-Trace, download and install the “J-Link Software and Documentation Pack” and “Ozone – The J-Link Debugger software”. These are required to communicate with the debug probe and debug your code.

Step 3: Compile and upload your code.
Depending on which SDK/IDE you are using, follow the regular process to compile and upload your code. If you are using the Arduino IDE, do not close the IDE window after uploading, as doing so will delete the compiled application file from the temporary folder.

Step 4: Connect the debug probe.
The RTL8722 EVB has SWD debug pins located on the top left of the board, when the USB ports are pointed downwards, as seen here:


Connect the SWD debug pins to the J-Link debug probe following the SWD pinout: J-Link Interface Description.

Step 5: Run and setup Ozone
Launch the Ozone application. The New Project Wizard should pop up. Choose the Cortex-M33 as the target device.

In the next window, you should be able to see and select the J-Link debug probe connected to the PC. Ensure that SWD is selected as the target interface.

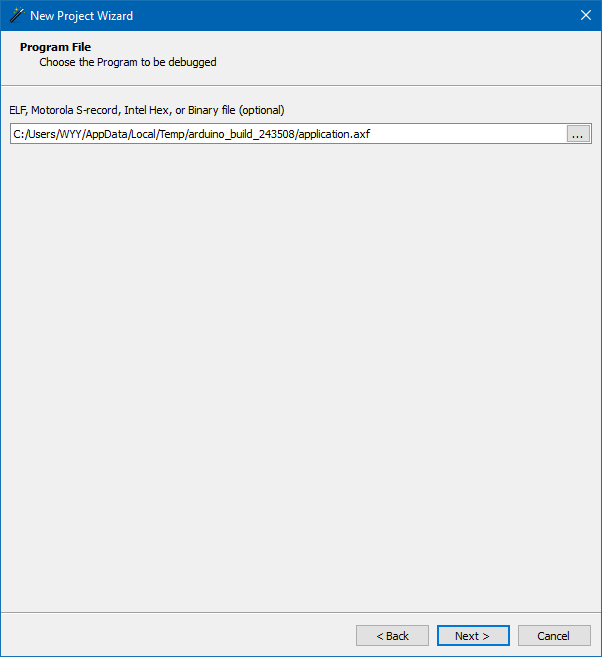
In the next window, you will need to provide Ozone with the compiled application file.

  • If you are using Arduino IDE, go to C:\Users\%USERNAME%\AppData\Local\Temp, and look for a folder that looks like “arduino_build_243508” with different numbers. The folder’s modified date and time should correspond to time of compilation. Provide Ozone with the path to the “application.axf’ file in the folder.
  • If you are using the GCC SDK, provide the path to the “target_img2.axf” file in the “\project\realtek_amebaD_va0_example\GCC-RELEASE\project_hp\asdk\image” folder.

In the next window, provide Ozone with the path to the “AP2_KM4.JLinkScript” file, which can be found in “\project\realtek_amebaD_va0_example\GCC-RELEASE\project_hp\jlink_script” or downloaded from ambd_sdk/AP2_KM4.JLinkScript at master · ambiot/ambd_sdk · GitHub.

Step 6: Debug
You are now ready to debug. You should see your code opened in the central window, with the cursor at the main function of main.cpp or main.c file. Reset the RTL8722, ensure that your code is running on the EVB, and click on “Attach to running program” in the top left next to the green power icon to start debugging.
Note: This method only enables partial debugging support. Flash related functions are not available. Reset to main may also not work correctly, so you will need to use attach to running program.

3 Likes

A quick question… does it means that the Segger IDE can support the AmebaD 8722EVB too?
if yes… I prefer the Segger on using the IAR.
I checked it once, but it fails on special calls which is used by the IAR only…
Evyatar

Note that Segger’s Ozone is not an IDE, you can think of it as a GUI for debugging. You will still need another IDE to do your programming in.
But even if you are using the GCC SDK for the RTL8722DM EVB, this method can be used to debug it. The settings and configuration are essentially the same, and you can find the target_img2.axf file in the asdk\image folder.

Hi

Please direct (or send) me to the target_img2.axf file, since it is totally missing, even from the downloaded SDK, and in the net there is only a pointer to it (in a file name rtl872xd/gen_crc_bin.mk at https://code.aliyun.com/alios_bull/alios/blob/9940245b747eaffcd344c8c5941db6651cd725ec/platform/mcu/rtl872xd/gen_crc_bin.mk)
Maybe this missing file cause to the problems i have…

Thank you

‫בתאריך יום ב׳, 5 באפר׳ 2021 ב-16:28 מאת ‪wyy via Realtek Ameba IOT Developers Forum (RTL8722 RTL8195 RTL8710 RTL8720 BW16 Development board) - IOT / MCU Solutions 瑞昱開發者論壇 開發板 开發者论坛 开發板‬‏ <‪ameba@discoursemail.com‬‏>:‬

The target_img2.axf file should be a output of the process of compiling your code, in either the GCC SDK or Arduino IDE. It contains the functionality you programmed into the code, and is unique each time you change your code.

For example, I can send you a target_img2.axf for my code, which may blink a LED. But this will not correspond to your code that connects to WiFi, and debugging will not make sense.

I followed your procedure. When i attach, i can get to my breakpoint1. Hit run and all goes well.
If i’m running i can set breakpoint1.
If i’m stopped at breakpoint1 i can set or unset breakpoint2.

The problems are:
If im running i can’t set breakpoint2.
If the processor is stopped at breakpoint2 and press run, if fails.
If the debugging is stopped and i put 3 breakpoints, when i attach, it fails.

It looks like depending on where i put my breakpoints, it will work sometime or not depending on when i put it.
The adress 0xE0017F6 changes sometime.
Could not read memory location 0xE0017F6 when trying to set soft RAM BP
Could not start CPU core. (ErrorCode: -2)
SetBreakpoint: JLINK API call failed
Connection to target device lost.
Disconnected from target device.

The adress 0xE0017F6 changes sometime.

About my setup:
I have a RTL8721DM on a SparkFun AzureWave Thing Plus - AW-CU488 connected with a J-Link Plus.
I’m on Windows 10 native.
My code is compiled in WSL2 ubuntu 20.04.
My USB J-Link is fowarded to a WSL2 ubuntu 20.04 through usbpid.
Ozone is running on WSL2.

@jallaire

The breakpoint issues you are facing are due to the limited hardware breakpoints in the chip.
The RTL872XDM chip only has 2 hardware breakpoints, and software breakpoints are not supported.

0xE0017F6 is in flash and not RAM. The debugger is trying to set a breakpoint in flash, but it is treating it like RAM, thus the process failed. Flash breakpoints is a feature that requires SEGGER specific code for the chip, and is not supported.

You could try to use the JLinkScript file from here, and see if that improves the debugging process. This contains the flash and ram memory regions and also disables flash breakpoints, so that should limit invalid breakpoint placement.

1 Like